Chemical tanker schedules slip when port congestion pops up unexpectedly or when AIS-reported ETAs lag reality. In this post, you’ll learn how to programmatically track chemical tankers, compute robust ETAs, and factor in port congestion—so your planners, chartering, and terminal ops teams can make decisions on reliable data.
Why chemical tanker tracking requires tighter signals
Chemical cargoes are higher value and often parcelized across multiple receivers. That means arrival windows matter, berth windows are tight, and any anchorage delay ripples across barges, shore tanks, and trucks. You need:

- Live tracking plus up to 168 hours of history to spot slowdowns and reroutes.
- Port congestion telemetry to quantify anchorages and berth utilization.
- Expected arrivals to validate declared destinations and ETAs.
- Fleet rollups for planners who manage dozens of hulls across regions.
With vessels-api.com you work from a single REST surface (18 endpoints) using one API key and a consistent JSON envelope {status, success, message, data}. Coverage is global with near real-time refresh. The following sections show how to wire up chemical tanker dashboards and workflows with minimal code.
Endpoints that matter for chemical tanker ETAs and congestion
We’ll focus on these endpoints and explain where each fits into ETA logic:
- /vessels/track — live AIS, voyage route, and optional predicted ETA/weather
- /ports/congestion — real-time congestion snapshot and wait-time statistics
- /port/expected-arrivals — who is inbound, when, and from where
- /vessels/analytics — travel speeds, distances, and port calls for trend baselining
- /vessels/fleet (POST) — batch tracking for whole-portfolio views
Live AIS and route context: GET /vessels/track
Start with the authoritative AIS feed for a hull. For chemical tankers, we recommend pulling at least 24–48 hours of history to identify slow-steaming periods or loitering before anchorage. The endpoint also returns current voyage route and last port visits.
Base URL: https://vessels-api.com/api/V1
Authentication: X-API-Key header
Official sample request (copy-paste as-is):
curl -H "X-API-Key: YOUR_API_KEY" "https://vessels-api.com/api/V1/vessels/track?mmsi=258785000&hours=48"Official sample response (unchanged):
{
"status": 200,
"success": true,
"message": "OK",
"data": {
"vessel": {
"imo": "9122556",
"mmsi": "258785000",
"name": null
},
"current_position": {
"latitude": 53.33708,
"longitude": 7.17993,
"speed_knots": 0,
"course_degrees": 212,
"heading_degrees": null,
"navigational_status": 5,
"timestamp_utc": "2017-01-24T04:07:35+00:00",
"age_minutes": 5101700,
"destination": null,
"eta": null
},
"predicted_eta": null,
"position_history": [],
"route": {
"departure_port": "HERACLIO",
"departure_time": "2026-04-27T21:35:36+00:00",
"destination_port": "HERACLIO",
"eta": "2026-04-30T09:00:00+00:00",
"distance_nm": null,
"avg_speed_knots": 17.1
},
"last_port_visits": [
{
"port_id": "156",
"port_name": "EMDEN",
"arrival_time": "2026-07-30T13:00:10+00:00",
"departure_time": null,
"duration_hours": null
},
{
"port_id": "10",
"port_name": "HERACLIO",
"arrival_time": "2026-04-20T12:00:00+00:00",
"departure_time": "2026-04-23T08:00:00+00:00",
"duration_hours": 68
}
],
"weather": null
}
}
Fields you’ll actually use for ETAs and alerts:
- data.current_position: latitude/longitude in decimal degrees, speed_knots in knots, course_degrees (COG), timestamp_utc in ISO 8601 (UTC). Navigational status is an AIS code; 5 typically denotes moored/anchored contexts you can use to infer waiting.
- data.route: departure_port/destination_port strings, eta timestamp (voyage-declared), and avg_speed_knots you can fold into drift/slowdown logic.
- data.predicted_eta: a model-predicted ETA if available; treat as a confidence-improving signal alongside route. When null, compute your own using speed-over-ground.
- data.last_port_visits: use to validate reported origin/last-known port calls for customs and scheduling.
Quantify delays: GET /ports/congestion
Congestion is the missing piece when an AIS-reported ETA drifts. For chemical tankers, anchorage stacks can add hours to days depending on berth class and tank availability. Use the congestion snapshot to put a quantitative delay factor into ETA windows.
Required parameter: port_id (UNLOCODE, e.g., ARBUE for Buenos Aires, SGSIN for Singapore, NLRTM for Rotterdam). Optional: period=24h|3d|7d to scope stats.
Key response fields to consume:
- data.snapshot.vessels_in_anchorage and vessels_at_berth: instantaneous load.
- data.statistics.avg_wait_time_hours_last_7d and max_wait_time_hours_last_7d: planning heuristics for anchorage-to-berth transitions.
- data.statistics.avg_berth_time_hours_last_7d: estimate berth throughput; helps refine laytime and berth window modeling.
Tip: Use UNLOCODEs from the catalog; do not pass arbitrary strings. See /ports for the complete list and identifiers.
Confirm inbound line-ups: GET /port/expected-arrivals
Expected arrivals confirm who is on approach, with ETA and origin. This is useful when a chemical tanker is slow-steaming toward a congested port: you can gauge queue depth by tanker class, and cross-check whether your hull is listed with a matching ETA window.
Core fields to use: expected_arrivals[].{mmsi, imo, name, vessel_type, eta, departure_port}.
Baseline speeds and port-call patterns: GET /vessels/analytics
Use aggregated voyage statistics to build vessel-specific speed baselines. For example, a coated MR chemical tanker might average different speeds loaded vs. ballast; the 7–30 day aggregates help detect underperformance and refine ETAs.
Look at data.statistics.{total_distance_nm, avg_speed_knots, max_speed_knots, port_calls_count, total_time_in_port_hours} and ports_visited to detect frequent trade lanes that can seed route assumptions.
Portfolio view for schedulers: POST /vessels/fleet
Schedulers need a portfolio view. Use the fleet endpoint to fetch positions and routes for multiple tankers at once. This powers dashboards and alert fans without stitching N requests yourself.
You’ll receive fleet totals and a vessels[] array with per-hull position/route objects. Use this to render traffic-light status for “at sea,” “in anchorage,” “at berth.”
ETA strategy that blends AIS, congestion, and analytics
ETAs for chemical tankers benefit from a layered approach:
- Pull /vessels/track with include_predicted_eta where available. If data.predicted_eta is not null, treat it as a model estimate anchored to recent AIS.
- If predicted_eta is null, compute a naive ETA: distance-to-go (DTG) / speed_over_ground. When route.distance_nm is null, compute geodesic DTG to destination anchorage waypoint you maintain or infer from port coordinates.
- Adjust by congestion factor: if data.statistics.avg_wait_time_hours_last_7d exists for the destination in /ports/congestion, extend the window by that many hours. You can build P10/P50/P90 windows using min/avg/max wait times.
- Smooth with vessel analytics: if /vessels/analytics shows sustained avg_speed_knots materially below your speed assumption (e.g., by 1.5–2 knots), recalc ETA with that baseline.
- Cross-validate with /port/expected-arrivals: if the vessel appears with a declared eta that diverges from your blended estimate beyond a threshold, flag for operator review.
This approach keeps ETAs robust even when AIS messages carry null destination/ETA fields or when a vessel slows down for bunker/swell without changing destination.
Python code: compute a congestion-adjusted ETA
The snippet below calls the official track endpoint for the documented MMSI and derives a simplified ETA. It demonstrates how to read current_position, route, and predicted_eta; you can extend it with /ports/congestion to factor in a delay window.
import os
import requests
from datetime import datetime, timezone
from math import radians, sin, cos, asin, sqrt

API_KEY = os.getenv("VESSELS_API_KEY", "YOUR_API_KEY")
BASE_URL = "https://vessels-api.com/api/V1"

def haversine_nm(lat1, lon1, lat2, lon2):
# Haversine distance in nautical miles
R_km = 6371.0
dlat = radians(lat2 - lat1)
dlon = radians(lon2 - lon1)
a = sin(dlat/2)**2 + cos(radians(lat1)) * cos(radians(lat2)) * sin(dlon/2)**2
c = 2 * asin(sqrt(a))
km = R_km * c
return km * 0.539957

def get_track(mmsi):
url = f"{BASE_URL}/vessels/track"
params = {"mmsi": mmsi, "hours": 48}
r = requests.get(url, headers={"X-API-Key": API_KEY}, params=params, timeout=20)
r.raise_for_status()
return r.json()["data"]

def get_port_center(port_id):
# Optional: resolve destination anchor/berth coords via /ports or /ports/data
url = f"{BASE_URL}/ports/data"
r = requests.get(url, headers={"X-API-Key": API_KEY}, params={"port": port_id}, timeout=20)
r.raise_for_status()
d = r.json()["data"]
return d["latitude"], d["longitude"]

def compute_eta(track_data):
cp = track_data["current_position"]
route = track_data.get("route") or {}
predicted_eta = track_data.get("predicted_eta")

# 1) Use predicted ETA if available
if predicted_eta:
return predicted_eta

# 2) Else if route ETA is present, take it as declared ETA
if route and route.get("eta"):
return route["eta"]

# 3) Else compute naive ETA to destination port center at current SOG
dest_port = route.get("destination_port")
if not dest_port:
return None

lat, lon = cp["latitude"], cp["longitude"]
sog = max(cp.get("speed_knots") or 0.1, 0.1) # avoid divide-by-zero

dlat, dlon = get_port_center(dest_port)
dtg_nm = haversine_nm(lat, lon, dlat, dlon)
hours = dtg_nm / sog

eta_ts = datetime.now(timezone.utc).timestamp() + hours * 3600
return datetime.fromtimestamp(eta_ts, tz=timezone.utc).isoformat()

if __name__ == "__main__":
data = get_track("258785000")
eta = compute_eta(data)
vessel = data["vessel"]
print(f"Vessel MMSI {vessel['mmsi']} | IMO {vessel['imo']} | ETA: {eta}")
Notes:
- Timestamps are UTC ISO 8601 from the API; maintain UTC across your pipeline and localize only in the UI.
- Speed is in knots; distances are nautical miles when present. The haversine helper converts kilometers to NM.
- When course and destination are unstable, tighten your ETA window or expand the refresh cadence.
Add port congestion to the ETA window
To inject congestion, call /ports/congestion with the destination UNLOCODE and add the average wait-time to your lower bound, and the max wait-time to your upper bound. This yields a practical window while keeping the point estimate from predicted_eta or the naive model.
Programmatic outline:
- eta_point = predicted_eta or route.eta or computed ETA
- eta_min = eta_point + avg_wait_time_hours_last_7d
- eta_max = eta_point + max_wait_time_hours_last_7d
For chemical tankers, expose both an ETA point and an ETA window. Operators can act on the point; terminals and logistics can stage around the window.
Finding and batching chemical tankers
Use /vessels/search to snapshot a fleet segment (e.g., ship_type filters) and hydrate your database with IMO/MMSI pairs for Fleet ops. Then use /vessels/fleet to poll the whole set on a cadence (e.g., every 5–10 minutes) and push updates to a message bus.
Pagination is standard: data.pagination.{current_page, per_page, total, last_page}. Respect per_page ≤ 100 and iterate until current_page == last_page.
Operational guidance that saves time
- Authentication: send X-API-Key in every request. There’s no OAuth and no per-endpoint differences.
- Envelope: every response is {status, success, message, data}. Check success before dereferencing data.
- Units and time: speed_knots in knots, distance_nm in nautical miles, all timestamps are UTC ISO 8601.
- Error handling: 401 for missing/invalid key, 404 for vessel/port not found, 422 for out-of-range parameters, 429 for rate limits. Back off and retry with jitter on 429/5xx.
- Caching: for dashboard tiles, cache 15–60 seconds for /vessels/track and 5–10 minutes for /ports/congestion depending on your latency tolerance.
- History windows: hours is capped at 168 on /vessels/track. If you need older history for models, persist snapshots or schedule periodic pulls.
- Port identifiers: use UNLOCODEs exactly as provided in the title parentheses (e.g., ARBUE). Resolve via /ports or /ports/data before wiring user inputs.
Putting it together: a chemical tanker dashboard
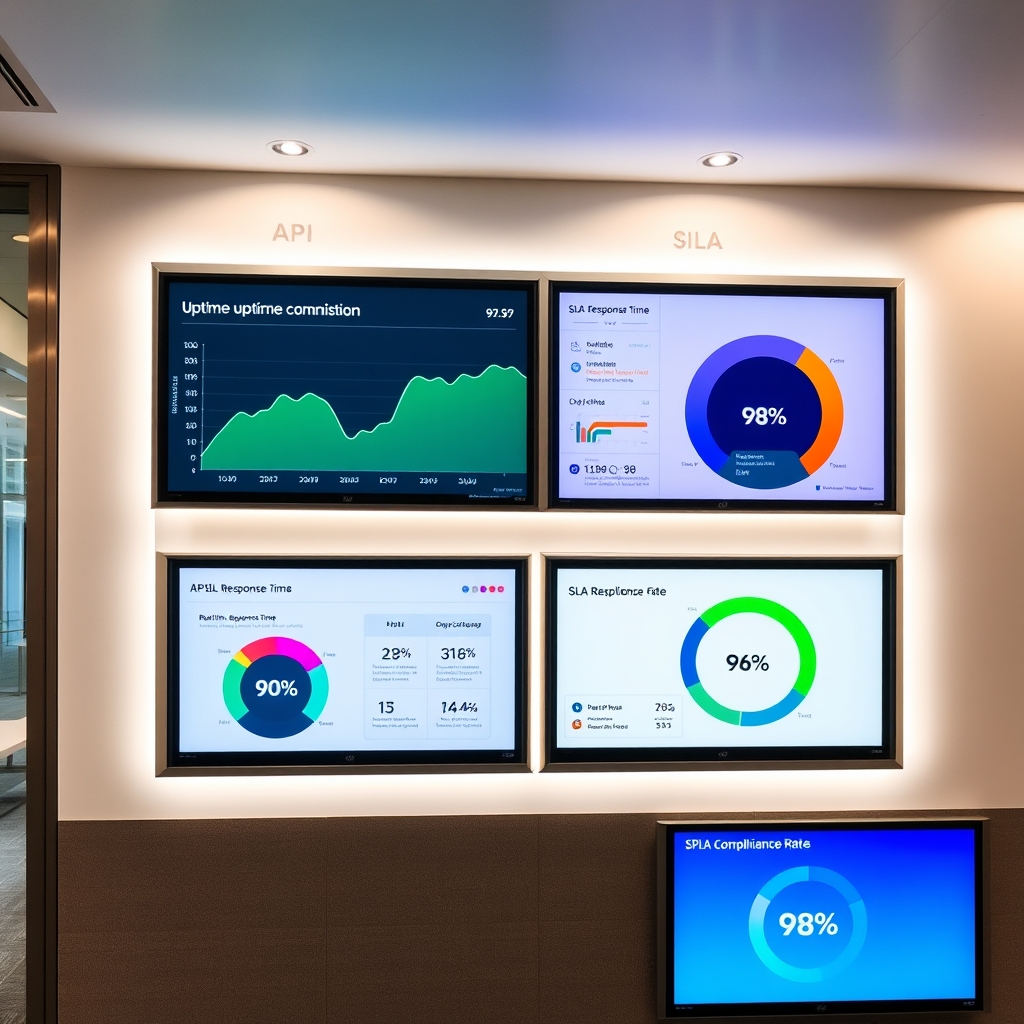
A pragmatic dashboard for chemical operations can be built around four widgets:
- Fleet map: /vessels/fleet with include_positions=true to show at-sea, in-anchorage, at-berth status. Color-code by navigational_status and speed threshold.
- ETA board: per-vessel blended ETA (predicted or computed) with a congestion-derived window. Store last refresh timestamp_utc for auditability.
- Port load: /ports/congestion for destination ports of interest. Render vessels_in_anchorage and vessels_at_berth; annotate with avg/max wait-time last 7 days.
- Line-up check: /port/expected-arrivals to confirm your vessels appear with consistent ETAs. Flag mismatches for operator intervention.
For full-stack systems, push the raw JSON envelopes to a log/topic (e.g., Kafka) and calculate ETAs in a stateless processor so you can backtest changes to the logic later.
Compliance note: CII signals for ESG teams
Even if your primary deliverable is an ETA board, many chemical tanker operators now surface emissions insights to ESG teams. You can enrich your object model with /vessels/green to attach CII rating snapshots (A–E) by period to each hull. This does not change ETA, but it helps allocate cleaner tonnage to sensitive cargoes or regions while scheduling.
Where to find everything
- Reference and endpoint details: Documentation
- Register an API key to start building: Register
- Discover the Model Context Protocol integration and tools: MCP
FAQ
What’s the fastest way to get a reliable ETA for a chemical tanker?
Call /vessels/track for the hull. If data.predicted_eta is present, use it as the point estimate. Otherwise, compute ETA from current_position and route, then widen with /ports/congestion wait-time stats at the destination UNLOCODE.
How often should I poll /vessels/track?
For ETA-critical voyages, 1–2 minute cadence is common. For fleet overviews, 3–5 minutes is usually sufficient. Use short cache TTLs and backoff on 429/5xx.
Do I need different auth for different endpoints?
No. Send X-API-Key in every request. All endpoints share the same authentication and response envelope.
How do I know which port_id to use for congestion?
Use /ports to retrieve the catalog and match by name/country, or /ports/data if you already know the identifier. The congestion endpoint requires the UNLOCODE (e.g., ARBUE, SGSIN, NLRTM).
Can I pull multiple vessels at once?
Yes. Use POST /vessels/fleet to request batch positions and routes in a single call. It also returns fleet rollups for fast dashboards.
Build a congestion-aware ETA workflow for your chemical tanker fleet in hours, not weeks. Start with the official Documentation, try the endpoints in your terminal, and get your key at Register. If you’re integrating with LLM tools or agents, explore the MCP resources to streamline your developer experience.